| Jewiki unterstützen. Jewiki, die größte Online-Enzyklopädie zum Judentum.
Helfen Sie Jewiki mit einer kleinen oder auch größeren Spende. Einmalig oder regelmäßig, damit die Zukunft von Jewiki gesichert bleibt ... Vielen Dank für Ihr Engagement! (→ Spendenkonten) |
How to read Jewiki in your desired language · Comment lire Jewiki dans votre langue préférée · Cómo leer Jewiki en su idioma preferido · בשפה הרצויה Jewiki כיצד לקרוא · Как читать Jewiki на предпочитаемом вами языке · كيف تقرأ Jewiki باللغة التي تريدها · Como ler o Jewiki na sua língua preferida |
Datei:Gaia’s Hertzsprung-Russell diagram ESA393151.jpg

Originaldatei (2.480 × 3.754 Pixel, Dateigröße: 1,46 MB, MIME-Typ: image/jpeg)


Beschreibung
| Beschreibung |
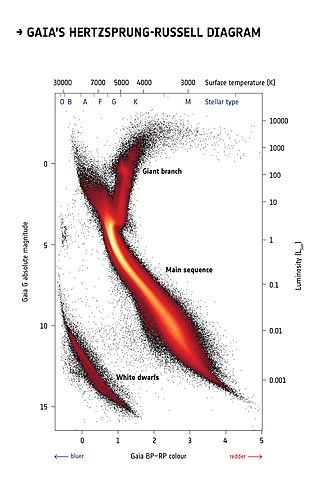
English: More than four million stars within five thousand light-years from the Sun are plotted on this diagram using information about their brightness, colour and distance from the second data release from ESA’s Gaia satellite. It is known as a Hertzsprung-Russell diagram after the astronomers who devised it in the early 20th century, and it is a fundamental tool to study populations of stars and their evolution.
This Hertzsprung-Russell diagram, obtained by a selection of stars in Gaia’s second release catalogue, is the most detailed to date made by mapping stars over the entire sky, containing roughly a hundred times more stars thanthe one obtained using data from ESA’s Hipparcos mission, the predecessor of Gaia, in the 1990s. This new diagram contains so much highly accurate information that astronomers have been able to identify fine details that were never before seen. The Hertzsprung-Russell diagram can be imagined as a stellar family portrait: stars are plotted according to their colour (on the horizontal axis) and brightness (on the vertical axis) and are grouped in different regions of the diagram depending mainly on their masses, chemical composition, ages, and stages in the stellar life cycle. Information about stellar distances is fundamental to calculate the true brightness, or absolute magnitude, of stars. Brighter stars are shown in the top part of the diagram, while fainter stars are in the lower part. Bluer stars, which have hotter surfaces, are on the left, and redder stars, with cooler surfaces, on the right. The colour scale in this image does not represent the colour of stars but is a representation of how many stars are plotted in each portion of the diagram: black represents lower numbers of stars, while red, orange and yellow correspond to increasingly higher numbers of stars. The large diagonal stripe across the centre of the graph is known as the main sequence. This is where fully-fledged stars that are generating energy by fusing hydrogen into helium are found. Massive stars, which have bluer or whiter colours, are found in the upper left end of the main sequence, while intermediate-mass stars like our Sun, characterised by yellow colours, are located mid-way. Redder, low-mass stars are found towards the lower right. As stars age they swell up, becoming brighter and redder. Stars experiencing this are shown on the diagram as the vertical arm leading off the main sequence and turning to the right. This is known as the red giant branch. While the most massive stars swell into red giants and explode as powerful supernovae, stars like our Sun end their days in a less spectacular fashion, eventually turning into white dwarfs – the hot cores of dead stars. These are found in the lower left of the diagram. The huge leap forward from Hipparcos to Gaia is especially visible in thewhite dwarf region of the diagram. While Hipparcos had obtained reliable distance measurements to only a handful of white dwarfs, more than 35 000 such objects are included in this diagram based on Gaia data. This allows astronomers to see the signature of different types of white dwarfs such that a differentiation can be made between those with hydrogen-rich cores and those dominated by helium. Acknowledgement: Gaia Data Processing and Analysis Consortium (DPAC); Carine Babusiaux, IPAG – Université Grenoble Alpes, GEPI – Observatoire de Paris, France. |
| Datum | |
| Quelle | http://www.esa.int/spaceinimages/Images/2018/04/Gaia_s_Hertzsprung-Russell_diagram |
| Urheber | European Space Agency |
| Genehmigung (Weiternutzung dieser Datei) |
ESA/Gaia/DPAC,CC BY-SA 3.0 IGO |
| Title | Gaia’s Hertzsprung-Russell diagram |
| Mission | Gaia |
| Activity | Space Science |
Lizenz
- Dieses Werk darf von dir
- verbreitet werden – vervielfältigt, verbreitet und öffentlich zugänglich gemacht werden
- neu zusammengestellt werden – abgewandelt und bearbeitet werden
- Zu den folgenden Bedingungen:
- Namensnennung – Du musst angemessene Urheber- und Rechteangaben machen, einen Link zur Lizenz beifügen und angeben, ob Änderungen vorgenommen wurden. Diese Angaben dürfen in jeder angemessenen Art und Weise gemacht werden, allerdings nicht so, dass der Eindruck entsteht, der Lizenzgeber unterstütze gerade dich oder deine Nutzung besonders.
- Weitergabe unter gleichen Bedingungen – Wenn du das Material wiedermischst, transformierst oder darauf aufbaust, musst du deine Beiträge unter der gleichen oder einer kompatiblen Lizenz wie das Original verbreiten.
Dateiversionen
Klicke auf einen Zeitpunkt, um diese Version zu laden.
| Version vom | Vorschaubild | Maße | Benutzer | Kommentar | |
|---|---|---|---|---|---|
| aktuell | 16:05, 3. Apr. 2019 | | 2.480 × 3.754 (1,46 MB) | Fæ | European Space Agency, Id 393151, http://www.esa.int/spaceinimages/Images/2018/04/Gaia_s_Hertzsprung-Russell_diagram, User:Fæ/Project_list/ESA |
Dateiverwendung
Die folgende Seite verwendet diese Datei: