| Jewiki unterstützen. Jewiki, die größte Online-Enzyklopädie zum Judentum.
Helfen Sie Jewiki mit einer kleinen oder auch größeren Spende. Einmalig oder regelmäßig, damit die Zukunft von Jewiki gesichert bleibt ... Vielen Dank für Ihr Engagement! (→ Spendenkonten) |
How to read Jewiki in your desired language · Comment lire Jewiki dans votre langue préférée · Cómo leer Jewiki en su idioma preferido · בשפה הרצויה Jewiki כיצד לקרוא · Как читать Jewiki на предпочитаемом вами языке · كيف تقرأ Jewiki باللغة التي تريدها · Como ler o Jewiki na sua língua preferida |
Datei:BMI-30-Worldmap-2014.svg
Zur Navigation springen
Zur Suche springen


Größe der PNG-Vorschau dieser SVG-Datei: 800 × 382 Pixel. Weitere Auflösungen: 320 × 153 Pixel | 640 × 306 Pixel | 1.024 × 489 Pixel | 1.280 × 612 Pixel | 1.620 × 774 Pixel.
Originaldatei (SVG-Datei, Basisgröße: 1.620 × 774 Pixel, Dateigröße: 470 KB)
Beschreibung
| Beschreibung |
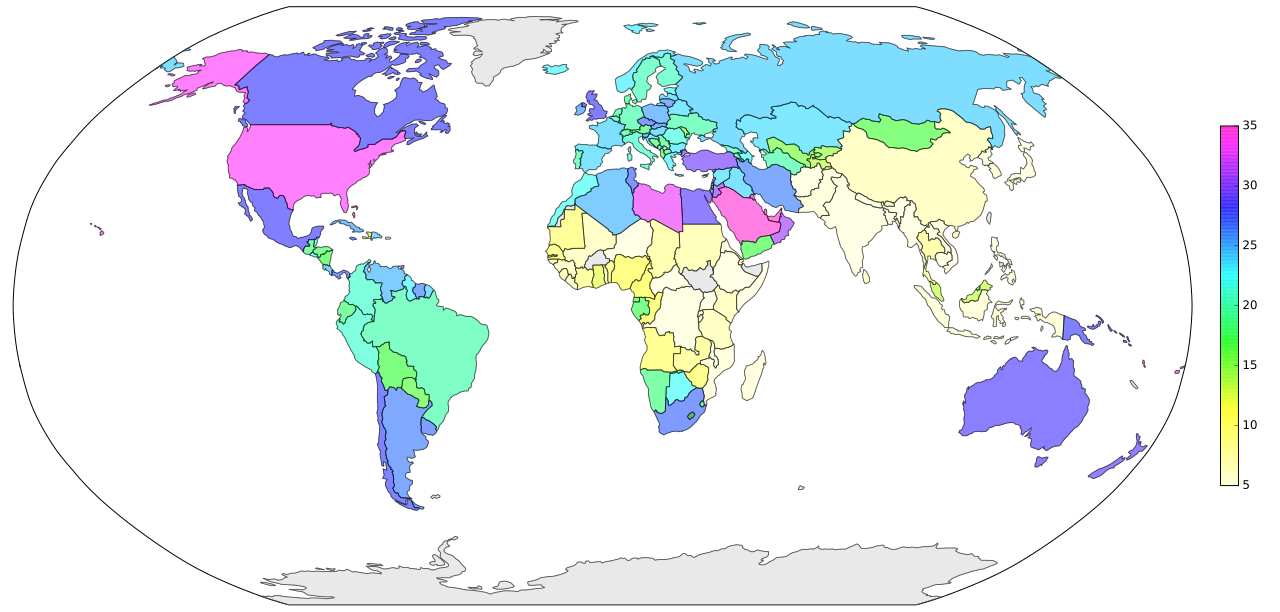
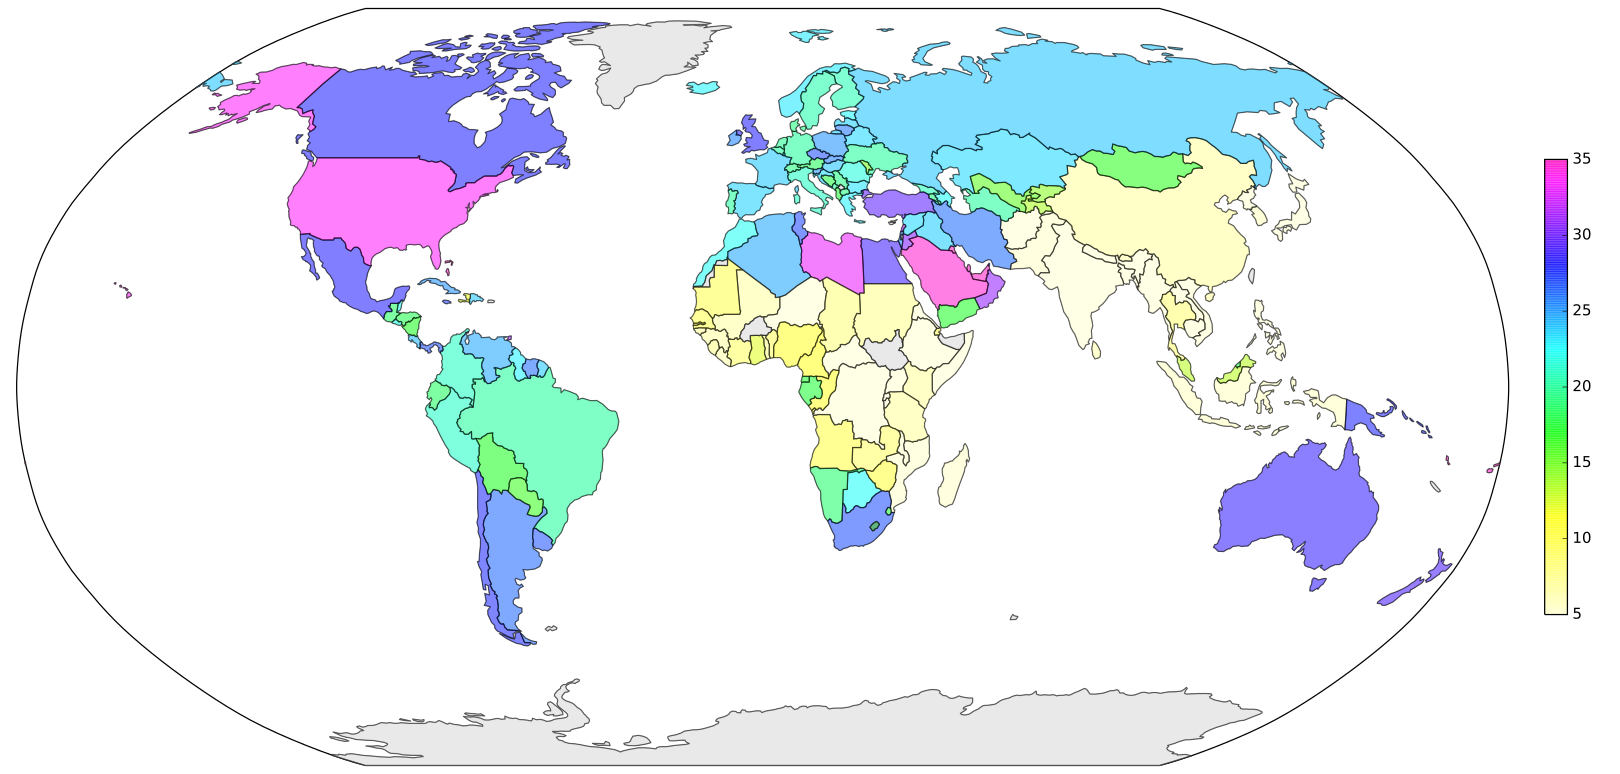
English: Percentage of people with a body mass index ≥ 30kg/m2 per country in 2014
Data from http://www.who.int/gho/ncd/risk_factors/overweight/en/ http://obesity.procon.org/view.resource.php?resourceID=006032 Country shapes from http://www.naturalearthdata.com/downloads/110m-cultural-vectors Created with Python and Matplotlib Basemap Toolkit. |
| Datum | |
| Quelle | Eigenes Werk |
| Urheber | MagHoxpox |
"""
Percentage of people with a body mass index >= 30kg/m^2 per country in 2014
Country shapes from http://www.naturalearthdata.com/downloads/110m-cultural-vectors/
"""

import numpy as np
from mpl_toolkits.basemap import Basemap
import matplotlib.pyplot as plt
from matplotlib.patches import Polygon, PathPatch
from matplotlib.collections import PatchCollection
from matplotlib.colors import LinearSegmentedColormap

#########################################################################################
# read values from data in wiki-table format
data = "".join(open("bmi30-wiki.txt").readlines())
data = data.replace("\n", "").replace("{","").replace("}","").replace("%","").replace(".","").replace(",",".").split("|-")[1:]
value={}
for line in data:
    line = line.split("|")
    val=float(line[3])
    key = line[2]
    value[key]=val

#########################################################################################
# draw empty worldmap
fig = plt.figure(figsize=(18,8.6))
plt.subplots_adjust(left=0.01, bottom=0.01, right=1.12, top=0.99)

m = Basemap(projection='robin',lon_0=0, llcrnrlat=-60,urcrnrlat=85, llcrnrlon=-180, urcrnrlon=180, resolution='l')
m.drawmapboundary()

#########################################################################################
# color country shapes
m.readshapefile('ne_110m_admin_0_countries/ne_110m_admin_0_countries', name='world', drawbounds=True, color='gray')

countries = []
undefined_countries = []
valueList  = []
lastValues = []
for info, shape in zip(m.world_info, m.world):
    try:
        key = info["ADM0_A3"]
        val = value[key]
    except KeyError:
        undefined_countries.append(Polygon(np.array(shape), True))
        continue

    pol = Polygon(np.array(shape), True)

    # Workaround: the inner borders of South Africa to Lesotho are missing.
    if key=="LSO":
        lastValues.append((pol, val))
    else:
        countries.append(pol)
        valueList.append(val)

for pol, val in lastValues:
    countries.append(pol)
    valueList.append(val)

valueArray = np.array(valueList)
print valueArray.min(), valueArray.max()
ticks = np.linspace(5, 35,7)

#########################################################################################
# colorbar, modified "gist_rainbow" theme
_gist_rainbow_data = (
        (0.000, (1.00, 1.00, 0.80)),
        #(0.030, (1.00, 0.00, 0.00)),
        (0.215, (1.00, 1.00, 0.00)),
        (0.400, (0.00, 1.00, 0.00)),
        (0.586, (0.00, 1.00, 1.00)),
        (0.770, (0.00, 0.00, 1.00)),
        (0.954, (1.00, 0.00, 1.00)),
        (1.000, (1.00, 0.00, 0.75)))
cm = LinearSegmentedColormap.from_list("cm", _gist_rainbow_data, 256)
p = PatchCollection(countries, alpha=0.5,  zorder=3, cmap=cm)
p.set_array(valueArray)
p.set_clim([ticks.min(), ticks.max()])

plt.gca().add_collection(p)
cb = fig.colorbar(p, ticks = ticks, shrink=0.6, pad = 0.02, drawedges=False)
cb.solids.set_edgecolor("face")

#########################################################################################
# set countries without data to lightgray
p2 = PatchCollection(undefined_countries, alpha=0.5,  zorder=3, cmap=LinearSegmentedColormap.from_list("lg", ["lightgray", "lightgray"]))
p2.set_array(np.ones((len(undefined_countries),)))
plt.gca().add_collection(p2)

#########################################################################################
# save and show
filename = "BMI-30-Worldmap-2014"
plt.savefig(filename + ".svg")

plt.show()
Lizenz
Ich, der Urheber dieses Werkes, veröffentliche es unter der folgenden Lizenz:
Diese Datei ist lizenziert unter der Creative-Commons-Lizenz „Namensnennung – Weitergabe unter gleichen Bedingungen 4.0 international“.
- Dieses Werk darf von dir
- verbreitet werden – vervielfältigt, verbreitet und öffentlich zugänglich gemacht werden
- neu zusammengestellt werden – abgewandelt und bearbeitet werden
- Zu den folgenden Bedingungen:
- Namensnennung – Du musst angemessene Urheber- und Rechteangaben machen, einen Link zur Lizenz beifügen und angeben, ob Änderungen vorgenommen wurden. Diese Angaben dürfen in jeder angemessenen Art und Weise gemacht werden, allerdings nicht so, dass der Eindruck entsteht, der Lizenzgeber unterstütze gerade dich oder deine Nutzung besonders.
- Weitergabe unter gleichen Bedingungen – Wenn du das Material wiedermischst, transformierst oder darauf aufbaust, musst du deine Beiträge unter der gleichen oder einer kompatiblen Lizenz wie das Original verbreiten.
Dateiversionen
Klicke auf einen Zeitpunkt, um diese Version zu laden.
| Version vom | Vorschaubild | Maße | Benutzer | Kommentar | |
|---|---|---|---|---|---|
| aktuell | 12:17, 6. Jan. 2018 | | 1.620 × 774 (470 KB) | MagHoxpox | User created page with UploadWizard |
Dateiverwendung
Die folgende Seite verwendet diese Datei: